State of the Nation’s Housing 2017

photo by woodleywonderworks

Harvard’s Joint Center for Housing Studies has released its excellent State of the Nation’s Housing for 2017, with many important insights. The executive summary reads, in part,

A decade after the onset of the Great Recession, the national housing market is finally returning to normal. With incomes rising and household growth strengthening, the housing sector is poised to become an important engine of economic growth. But not all households and not all markets are thriving, and affordability pressures remain near record levels. Addressing the scale and complexity of need requires a renewed national commitment to expand the range of housing options available for an increasingly diverse society.

National Home Prices Regain Previous Peak

US house prices rose 5.6 percent in 2016, finally surpassing the high reached nearly a decade earlier. Achieving this milestone reduced the number of homeowners underwater on their mortgages to 3.2 million by year’s end, a remarkable drop from the 12.1 million peak in 2011. In inflation-adjusted terms, however, national home prices remained nearly 15 percent below their previous high. As a result, the typical homeowner has yet to fully regain the housing wealth lost during the downturn.

*     *     *

Pickup In Household Growth

The sluggish rebound in construction also reflects the striking slowdown in household growth after the housing bust. Depending on the government survey, household formations averaged just 540,000 to 720,000 annually in 2007–2012 before reviving to 960,000 to 1.2 million in 2013–2015.

Much of the falloff in household growth can be explained by low household formation rates among the millennial generation (born between 1985 and 2004). Indeed, the share of adults aged 18–34 still living with parents or grandparents was at an all-time high of 35.6 percent in 2015. But through the simple fact of aging, the oldest members of this generation have now reached their early 30s, when most adults live independently. As a result, members of the millennial generation formed 7.6 million new households between 2010 and 2015.

*     *     *

Homeownership Declines Moderating, While Rental Demand Still Strong

After 12 years of decline, there are signs that the national homeownership rate may be nearing bottom. As of the first quarter of 2017, the homeownership rate stood at 63.6 percent—little changed from the first quarter two years earlier. In addition, the number of homeowner households grew by 280,000 in 2016, the strongest showing since 2006. Early indications in 2017 suggest that the upturn is continuing. Still, growth in renters continued to outpace that in owners, with their numbers up by 600,000 last year.

*     *     *

Affordability Pressures Remain Widespread

Based on the 30-percent-of-income affordability standard, the number of cost-burdened households fell from 39.8 million in 2014 to 38.9 million in 2015. As a result, the share of households with cost burdens fell 1.0 percentage point, to 32.9 percent. This was the fifth straight year of declines, led by a considerable drop in the owner share from 30.4 percent in 2010 to 23.9 percent in 2015. The renter share, however, only edged down from 50.2 percent to 48.3 percent over this period.

With such large shares of households exceeding the traditional affordability standard, policymakers have increasingly focused their attention on the severely burdened (paying more than 50 percent of their incomes for housing). Although the total number of households with severe burdens also fell somewhat from 19.3 million in 2014 to 18.8 million in 2015, the improvement was again on the owner side. Indeed, 11.1 million renter households were severely cost burdened in 2015, a 3.7 million increase from 2001. By comparison, 7.6 million owners were severely burdened in 2015, up 1.1 million from 2001.

*     *     *

Segregation By Income on The Rise

A growing body of social science research has documented the long-term damage to the health and well-being of individuals living in high-poverty neighborhoods. Recent increases in segregation by income in the United States are therefore highly troubling. Between 2000 and 2015, the share of the poor population living in high-poverty neighborhoods rose from 43 percent to 54 percent. Meanwhile, the number of high-poverty neighborhoods rose from 13,400 to more than 21,300. Although most high-poverty neighborhoods are still concentrated in high-density urban cores, their recent growth has been fastest in low-density areas at the metropolitan fringe and in rural communities.

At the same time, the growing demand for urban living has led to an influx of high-income households into city neighborhoods. While this revival of urban areas creates the opportunity for more economically and racially diverse communities, it also drives up housing costs for low-income and minority residents. (1-6, references omitted)

One comment, a repetition from my past discussions of Joint Center reports. The State of the Nation’s Housing acknowledges sources of funding for the report but does not directly identify the members of its Policy Advisory Board, which provides “principal funding” for it, along with the Ford Foundation. (front matter) The Board includes companies such as Fannie Mae, Freddie Mac and Zillow which are directly discussed in the report. In the spirit of transparency, the Joint Center should identify all of its funders in the State of the Nation’s Housing report itself. Other academic centers and think tanks would undoubtedly do this. The Joint Center for Housing Studies should follow suit.


Carson and Fair Housing

photo by Warren K. Leffler

President Johnson signing the Civil Rights Act of 1968 (also known as the Fair Housing Act)

Law360 quoted me in Carson’s HUD Nom Adds To Fair Housing Advocates’ Worries (behind a paywall). It opens,

President-elect Donald Trump’s Monday choice of Ben Carson to lead the U.S. Department of Housing and Urban Development added to fears that the incoming administration would pull back from the aggressive enforcement of fair housing laws that marked President Barack Obama’s term, experts said.

The tapping of Carson to lead HUD despite a lack of any relative experience in the housing sector came after Trump named Steven Mnuchin to lead the U.S. Department of the Treasury amid concerns that the bank for which he served as chairman engaged in rampant foreclosure abuses. Trump has also nominated Sen. Jeff Sessions, R-Ala., to serve as attorney general. Sessions has drawn scrutiny for his own attitudes towards civil rights enforcement.

Coupled with Trump’s own checkered history of run-ins with the U.S. Justice Department over discriminatory housing practices, those appointments signal that enforcement of fair housing laws are likely to be a low priority for the Trump administration when it takes office in January, said Christopher Odinet, a professor at Southern University Law Center.

“I can’t imagine that we’ll see any robust enforcement or even attention paid to fair housing in this next administration,” he said.

Trump said that Carson, who backed the winning candidate after his own unsuccessful run for the presidency, shared in his vision of “revitalizing” inner cities and the families that live in them.

“Ben shares my optimism about the future of our country and is part of ensuring that this is a presidency representing all Americans. He is a tough competitor and never gives up,” Trump said in a statement released through his transition team.

Carson said he was honored to get the nod from the president-elect.

“I feel that I can make a significant contribution particularly by strengthening communities that are most in need. We have much work to do in enhancing every aspect of our nation and ensuring that our nation’s housing needs are met,” he said in the transition team’s statement.

The problem that many are having with this nomination is that Carson has little to no experience with federal housing policy. A renowned neurosurgeon, Carson’s presidential campaign website made no mention of housing, and there is little record of him having spoken about it on the campaign trail. One Carson campaign document called for privatizing Fannie Mae and Freddie Mac, the government-run mortgage backstops that were bailed out in 2008.

The nomination also comes in the weeks after a spokesman for Carson said that the former presidential candidate had no interest in serving in a cabinet post because he lacked the qualifications. That statement has since been walked back but has been cited by Democrats unhappy with the Carson selection.

“Cities coping with crumbling infrastructure and families struggling to afford a roof overhead cannot afford a HUD secretary whose spokesperson said he doesn’t believe he’s up for the job,” said Sen. Sherrod Brown of Ohio, the ranking Democrat on the Senate Banking Committee. “President-elect Trump made big promises to rebuild American infrastructure and revitalize our cities, but this appointment raises real questions about how serious he is about actually getting anything done.”

HUD is a sprawling government agency with a budget around $50 billion and programs that include the Federal Housing Administration, which provides financing for lower-income and first-time homebuyers, funding and administration of public housing programs, disaster relief, and other key housing policies.

It also helps enforce anti-discrimination policies, in particular the Affirmatively Furthering Fair Housing rule that the Obama administration finalized. The rule, which was part of the 1968 Fair Housing Act but had been languishing for decades, requires each municipality that receives federal funding to assess their housing policies to determine whether they sufficiently encourage diversity in their communities.

Carson has not said much publicly about housing policy, but in a 2015 op-ed in the Washington Times compared the rule to failed school busing efforts of the 1970s and at other times called the rule akin to communism.

“These government-engineered attempts to legislate racial equality create consequences that often make matters worse. There are reasonable ways to use housing policy to enhance the opportunities available to lower-income citizens, but based on the history of failed socialist experiments in this country, entrusting the government to get it right can prove downright dangerous,” wrote Carson, who lived in public housing for a time while growing up in Detroit.

That dismissiveness toward the rule has people who are concerned about diversity in U.S. neighborhoods and anti-discrimination efforts on edge, and could put an end to federal efforts to improve those metrics.

“If you’re not affirmatively furthering fair housing, we’re going to be stuck with the same situation we have now or it’s going to get worse over time,” said David Reiss, a professor at Brooklyn Law School and research affiliate at New York University’s Furman Center.

Walkers in the City

photo by Derrick Coetzee

The Center for Real Estate and Urban Analysis at The George Washington School of Business has released Foot Traffic Ahead: Ranking Walkable Urbanism in America’s Largest Metros for 2016. The Executive Summary opens,

The end of sprawl is in sight. The nation’s largest metropolitan areas are focusing on building walkable urban development.

For perhaps the first time in 60 years, walkable urban places (WalkUPs) in all 30 of the largest metros are gaining market share over their drivable sub-urban competition—and showing substantially higher rental premiums.

This research shows that metros with the highest levels of walkable urbanism are also the most educated and wealthy (as measured by GDP per capita)— and, surprisingly, the most socially equitable. (4)

This strikes me as a somewhat over-optimistic take on sprawl, but I certainly welcome the increase in walkable urban places over a broad swath of metropolitan areas. The report’s specific findings are that

There are 619 regionally significant, walkable urban places—referred to as WalkUPs—in the 30 largest U.S. metropolitan areas. These 30 metros represent 46 percent of the national population (145 million of the 314 million national population) and 54 percent of the national GDP.

The 30 metros are ranked on the current percentage of occupied walkable urban office, retail, and multi-family rental square feet in their WalkUPs, compared to the balance of occupied square footage in the metro area. The six metros with the most walkable urban space in WalkUPs are, in rank order, New York City, Washington, DC, Boston, Chicago, San Francisco, and Seattle.

Economic Performance: There are substantial and growing rental rate premiums for walkable urban office (90 percent), retail (71 percent), and rental multi-family (66 percent) over drivable sub-urban products. Combined, these three product types have a 74 percent rental premium over drivable sub-urban.

Walkable urban market share growth in office and multi-family rental has increased in all 30 of the largest metros between 2010-2015, while drivable sub-urban locations have lost market share. The market share growth for 27 of the 30 metros is two times their market share in 2010. This is of the same or greater magnitude as the market share gains of drivable sub-urban development during its boom years in the 1980s, but in the reverse direction.

Indicators of potential future WalkUP performance show that many of the metros ranked highest for current walkable urbanism are also found at the top of our Development Momentum Ranking—namely, the metros of New York City, Boston, Seattle, and Washington, DC. This indicates that these metros will continue to build on their already high WalkUP market shares and rent premiums.

There are also some surprising metros in this top tier of Development Momentum rankings, including Detroit, Phoenix, and Los Angeles.

The most walkable urban metro areas have a substantially greater educated workforce, as measured by college graduates over 25 years of age, and substantially higher GDP per capita. These relationships are correlations, and determining the causal relationships requires further research to prove.

Walkable urban development describes trends resulting from both revitalization of the central city and urbanization of the suburbs. For nearly all metros, the future urbanization of the suburbs holds the greatest opportunity; metro Washington, DC, serves as a model, splitting its WalkUPs relatively evenly between its central city (53 percent) and its suburbs (47 percent).

Social Equity Performance: The national concern about social equity has been exacerbated by the very rent premiums highlighted above, referred to as gentrification. Counter-intuitively, measurement of moderate-income household (80 percent of AMI) spending on housing and transportation, as well as access to employment, shows that the most walkable urban metros are also the most socially equitable. The reason for this is that low cost transportation costs and better access to employment offset the higher costs of housing. This finding underscores for the need for continued, and aggressive, development of attainable housing solutions. (4, footnote omitted)

There is a lot of import here. Is there more than a correlation between walkability and the educational level of the workforce and, if so, why? Why don’t more housing affordability studies take into account transportation costs when evaluating the affordability of a given community? What is the trend line of this new direction toward urbanism and how far can it go in the face of decades of investment in car-based communities? This annual study will help us answer those questions, over time.

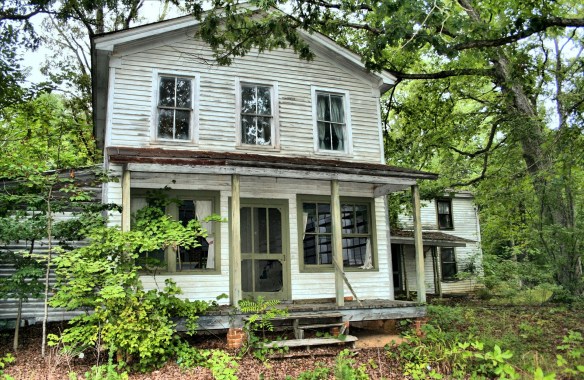
Buck-A-Home

abandoned house

The Saint Louis Post-Dispatch quoted me (from an AP story) in Kansas City Presses To Sell Eyesore, Vacant Homes for A Buck. It reads, in part,

Drawn to the idea of buying a house for just a buck, Dorian Blydenburgh paced through the century-old digs in south Kansas City and didn’t mind tree limbs on the living room floor, holes in the ceiling and a funky mold smell.

“This is one everyone is gonna want, and there’s gonna be a fight for this,” said Blydenburgh, 56, a contractor looking at the three-bedroom, 1,500-square-foot house at 4124 Chestnut Avenue as a makeover prospect for a friend, who later applied to buy it. “Some of these places you need a bulldozer to fix, but this is doable. For a dollar, it looks like a go.”

That’s what Kansas City, Mo., officials were hoping to hear. The city and the Land Bank of Kansas City have offered 130 derelict, generally unlivable structures for sale for $1 each to those willing to make them livable again within a year. The buyer’s reward is an eventual $8,500 rebate — the amount it would have cost the city to flatten the houses.

*     *     *

But it’s buyer beware. Applicants must undergo a background check — applicants who are registered sex offenders or have drug-dealing or prostitution convictions are disqualified — and prove through bank statements or unused credit card limits they have at least $8,500 to devote to the rehab.

Ultimately, the program’s backers warn, rehabbing the properties might cost tens of thousands of dollars, perhaps involving installing or repairing roofs, electrical systems, plumbing, heating and air conditioning or foundations. And that’s beyond the cost of tackling troubling unknowns such as lead or asbestos.

“Most of those buildings on the dangerous list are going to have to come down. We know that,” Mayor Sly James said. “But there are other homes on that low level that could be salvaged, and we want people to know they are out there.”

Other cities have tried similar approaches. In Detroit, with the help of tens of millions of dollars from taxpayers, the city has torn down about 7,100 of an estimated 30,000 to 40,000 vacant houses since May 2014, with the mayor planning to have an additional 15,000 homes gone by 2018. More than 1,300 other homes have been auctioned, Detroit Land Bank Authority spokesman Craig Fahle said. Buyers of those properties, many fetching just the opening bid of $1,000, are required to bring the house up to code and have it occupied within six months — nine months if it’s in a historic district.

Chicago and Milwaukee have are unloading vacant lots. Chicago has sold more than 400 vacant parcels since 2014. In Milwaukee, homeowners next to a vacant lot can buy it for $1.

David Reiss, a Brooklyn Law School professor who focuses on real estate issues and community development, urges would-be buyers to understand the expenses beyond the price tag, including property taxes, upkeep and liability insurance.

“A house for a dollar may be an albatross around your neck,” he said. “I would look at it case by case. If it sounds too good, it probably is.”

Tag

Dollar Homes

Packmatt

Realtor.com quoted me in Buy a House for a Buck? The Real Story Behind $1 Listings. The story reads, in part,

Hidden deep within the bowels of real estate listings are a few head-scratchers that would no doubt catch any bargain hunter’s eye. They’re homes for sale for the grand total of one crisp American dollar. So what’s the deal? Are they for real?

I decided to find out by actually clicking, and calling, and learning the stories behind these tempting facades. And it turns out, $1 listings can mean many things. Here’s what this lowball price is actually all about.

*     *     *

Possibility No. 3: It truly is for sale for $1, but…

The next four places for $1 that I check out are all rundown properties in Detroit. They range in description from “fire damage sold as is” (translation: a charred pile of lumber—pic below) to “bungalow with three bedrooms, one bathroom, basement and much more” (translation: “more” means plywood for windows and doors).

Still, some houses sit on decent lot sizes of 3,000+ square feet in neighborhoods that seem habitable at first glance. The listing agent won’t return my call, but I track down an agent willing to show me the various rundown homes. Though back taxes or liens on the property may jack up the price, I ask whether the house will really sell for $1. “Sure,” he says. “This is Detroit.”

Now that I’ve found a true $1 listing, should I hand over a George Washington for one of these fixer-uppers?

“When a house is being sold for a dollar, it means that the local real estate market has cratered,” says David Reiss, professor of law at Brooklyn Law School who focuses on real estate issues and community development. “Land has no value. Or even worse, it has negative value and buyers of $1 homes will end up getting snookered. Owning land comes with various mandatory expenses like real property taxes. It’s possible the true value is even lower than a dollar. In that case, you will see a lot of $1 houses staying on the market, as hard as that is to believe.”

Reiss further explains how the Motor City’s market cratered so deeply: “Real estate’s value typically comes down to location. If jobs have disappeared, if residents have disappeared, if services have disappeared—then value disappears.”

Beyond having zero worth, a $1 home is likely a gaping money pit. When the New York Times ran a piece on the subject in 2007, it found that “the houses often require hundreds of thousands of dollars in renovations.”

Though my search for $1 properties was a bust in the end, there once were $1 homes worth buying. “Think of New York City,” says Reiss. “Homes that were abandoned in the 1970s are now selling for seven figures.”

Bottom line? One-dollar listings may be a risky gamble, but, hey, you never know.


The Housing/Income Affordability Gap

We need affordable housing

The Urban Institute has issued a policy brief, The Housing Affordability Gap for Extremely Low-Income Renters in 2013. The brief opens,

Since 2000, rents have risen while the number of renters who need low-priced housing has increased. These two pressures make finding affordable housing even tougher for very poor households in America. Nationwide, only 28 adequate and affordable units are available for every 100 renter households with incomes at or below 30 percent of the area median income. Not a single county in the United States has enough affordable housing for all its extremely low-income (ELI) renters. The number of affordable rental homes for every 100 ELI renters ranges from 7 in Osceola County, Florida, to 76 in Worcester County, Maryland.

*     *     *

This brief is the first publication on housing affordability to combine detailed county-level data on ELI renter households (those with incomes at or below 30 percent of the area median) and the impact of US Department of Housing and Urban Development (HUD) rental assistance. Its four key findings:

  • Supply is not keeping up with demand. Between 2000 and 2013, the number of ELI renter households increased 38 percent, from 8.2 million to 11.3 million. At the same time, the supply of adequate, affordable, and available rental homes for these households increased only 7 percent, from 3.0 million to 3.2 million.
  • The gap between ELI renter households and suitable units is widening over time. From 2000 to 2013, the number of adequate, affordable, and available rental units for every 100 ELI renter households nationwide declined from 37 to 28.
  • Extremely low-income renters increasingly depend on HUD programs for housing. More than 80 percent of adequate, affordable, and available homes for ELI renter households are HUD-assisted, up from 57 percent in 2000.
  • The supply of adequate, affordable, and available units varies widely across the country. Among the 100 largest US counties, Suffolk County, which includes Boston, comes closest to meeting its area’s need, with 51 units per 100 ELI renter households.Denton County, part of the Dallas-Ft. Worth metropolitan area, has the largest housing gap,with only 8 units per 100 ELI renters. Rust Belt areas (e.g., Detroit, MI; Chicago,IL, and Milwaukee, WI) have seen large declines in adequate, affordable, and available units. Most counties had fewer units available in 2013 than 2000. Notable exceptions to this trend include Suffolk, MA; Los Angeles, CA; and Miami, FL, which have expanded their number of available units since 2000. (1-2, footnote omitted)

The brief concludes, “Simply put, virtually no affordable housing units would be available to ELI households absent the continued investment in federally assisted rental housing.” (14)

This is an affordable housing story, but it is just as much an income story — low-income households are getting left behind in the race between rising income and expenses. One solution is to expand housing assistance for low-income families. Another is to increase income, one way or another. The bottom line, though, is that low-income households don’t have enough to make a go of it in these United States.

Seeking Justice Through Litigation

AbandonedHouseDelray

Judge Caproni (SDNY) issued an Opinion and Order in Adkins v. Morgan Stanley, No. 12-CV-7667 (May 14, 2015). It opens,

This is one of many cases arising out of the collapse of the housing market. This one comes with a twist: homeowners in Detroit who received subprime loans seek to hold a single investment bank responsible under the Fair Housing Act (“FHA”) for discriminating against African-American borrowers, based on their claim that African-Americans were more likely than similarly-situated white borrowers to receive so-called “Combined-Risk loans.” Plaintiffs allege that Morgan Stanley so infected the market for residential mortgages — and for mortgages written by New Century Mortgage Company, a now defunct loan originator, in particular — that it bears responsibility for the disparate impact of New Century’s lending practices. Although Plaintiffs advance creative theories, their class action lawsuit founders on the requirements of Federal Rule of Civil Procedure 23. (1-2, footnote omitted)

Judge Caproni notes that she is “not unsympathetic to Plaintiff’s claims,” she concludes that this class action lawsuit is an inappropriate vehicle to rectify the wrong that Plaintiffs allege Morgan Stanley perpetrated.” (2) I am not an expert on the law of class actions, but the opinion does seem to identify a number of ways in which the proposed class is “unworkable.” (2)

We are now nearly ten years in from the start of the financial crisis and it seems like we can get a broad sense of whether justice has been served.  My instinct is that many people would say “No,” a resounding “No!”

At first glance that might seem odd, particularly to the shareholders and management of financial institutions who have paid tens of billions of dollars in fines and judgments. But there is a strong sense that those who have been harmed have not been able to get their day in court with those who did the harming. A case like this reveals the limitations of litigation as a means for seeking justice. Not every injustice is capable of being remedied in a court of law.

What does this tell us about preparing for the aftermath of the next crisis? How can laws be changed now to ensure that the right people and institutions are held accountable when it hits? While there are no easy answers to these questions, lawmakers should consider whether the scope of organizational liability is properly defined, whether agents of organizations are properly held accountable and whether organizations working in tandem with each other can be properly held accountable for the harms that they cause collectively. Easier said than done, I know, but still worth the effort.