Big Eviction Data

photo by Tim Patterson

The Eviction Lab, run by Princeton University Professor Matthew Desmond (of Evicted fame) has recently released its Methodology Report and related resources. The introduction to the report opens,

In recent years, renters’ housing costs have far outpaced their incomes, driving a nationwide affordability crisis. Current data from the American Housing Survey show that most poor renting families spend at least 50 percent of their income on housing costs. Under these conditions, 1 millions of Americans today are at risk of losing their homes through eviction.

An eviction occurs when a landlord forcibly expels a tenant from a residence. While the majority of evictions are attributed to nonpayment of rent, landlords may evict tenants for a variety of other reasons, including property damage, nuisance complaints, or lease violations. A formal eviction occurs when a landlord carries out an eviction through the court system. Conversely, an informal eviction occurs when a landlord executes an eviction without initiating a legal process. For example, a landlord may offer a buyout or perform an illegal lock-out. Until recently, little was known about the prevalence, causes, and consequences of eviction.

The Eviction Lab at Princeton University has collected, cleaned, geocoded, aggregated, and publicized all recorded court-ordered evictions that occurred between 2000 and 2016 in the United States. This data set consists of 82,935,981 million court records related to eviction cases in the United States between 2000 and 2016, gleaned from multiple sources. It is the most comprehensive data set of evictions in America to date.

These data allow us to estimate the national prevalence of court-ordered eviction, and to compare eviction rates among states, counties, cities, and neighborhoods. We can observe eviction trends over time and across geography, and researchers can link these data to other sources of information. (2)

In sum, the Eviction Lab has created “the most comprehensive data set of evictions in America.” (41) This data set is obviously of great importance and will lead to important research about what it means to be poor in the United States. The Eviction Lab website has a user-friendly mapping function among other resources for researchers and policymakers.

Framing Bipartisan Housing Finance Reform

photo by Jan Tik

The Bipartisan Policy Center has issued A Framework for Improving Access and Affordability in a Reformed Housing Finance System. The brief was written by Michael Stegman who had served as the Obama Administration’s top advisor on housing policy. It opens,

With policymakers gearing up to reform the housing finance system, it is worth revisiting one of the issues that stymied negotiators in the reform effort of 2014: how to ensure adequate access to credit in the new system. The political landscape has changed substantially since 2014. For those who are focused on financing affordable housing and promoting access to mortgage credit, the status quo—the continued conservatorship of Fannie Mae and Freddie Mac—may no longer be as appealing as it was during those negotiations. This brief draws upon the lessons learned from that experience to outline a framework for bipartisan consensus in this transformed political environment.

The “middle-way” approach described here is not dependent upon any one structure or future role for the government-sponsored enterprises (GSEs), though it does assume the continuation of a government guarantee of qualified mortgage-backed securities (MBS). It is this guarantee that forms the basis of the obligation to ensure that the benefits flowing from the government backstop are as broadly available as possible, consistent with safety and soundness and taxpayer protection.

In recent months, at least three such proposals have been developed that preserve a federal backstop (see Mortgage Bankers Association, Bright and DeMarco, and Parrott et al. proposals). Should the administration and Congress pursue a strict privatization approach to reform, lacking a guarantee, it’s unlikely that any affordable housing obligations would be imposed in the reformed system. (cover page, footnotes omitted)

Stegman goes on to describe “The Affordable Housing Triad:”

Over the years, Congress has made it clear that the GSEs’ public purpose includes supporting the financing of affordable housing and promoting access to mortgage credit “throughout the nation, including central cities, rural areas, and underserved areas,” even if doing so involves earning “a reasonable economic return that may be less than the return earned on other activities.” As part of this mandate, policymakers have created a triad of affordable housing and credit access requirements:

  1. Meeting annual affordable-mortgage purchase goals set by the regulator;
  2. Paying an assessment on each dollar of new business to help capitalize two different affordable housing funds; and
  3. Developing and executing targeted duty-to-serve strategies, the purpose of which is to increase liquidity in market segments underserved by primary lenders and the GSEs, defined by both geography and housing types. (1, footnote omitted)

The paper outlines three bipartisan options that would not

compromise the obligation to provide liquidity to all corners of the market at the least possible cost, consistent with taxpayer protection and safety and soundness. Each option attempts to ensure that the system as a whole provides access and affordability at least as much as the existing system; includes an explicit and transparent fee on the outstanding balance of guaranteed MBS; and includes a duty to serve the broadest possible market. (3)

The paper is intended to spark further conversation about housing finance reform while advocating for the needs of low- and moderate-income households. I hope it succeeds in pushing Congress to focus on the details of what could be a bipartisan exit strategy from the endless GSE conservatorships.


The Economic Implications of the Housing Supply

Ed Glaeser and Joe Gyourko posted The Economic Implications of the Housing Supply which is forthcoming in The Journal of Economic Perspectives. In it, they

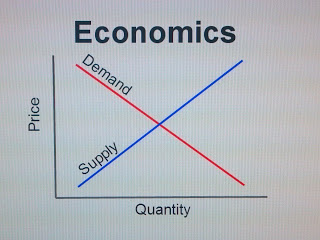
review the basic economics of housing supply and the functioning of U.S. housing markets to better understand the impacts on home prices, household wealth and the spatial distribution of people across markets. Section II documents the state of housing affordability in the U.S., and begins with three core facts about housing supply. First, when building is unrestricted by regulation or geography, housing supply curves seem relatively flat, meaning that we can approximate reality by referring to a single production cost. Second, both geography and regulation severely restrict the ease of building in some parts of the country. These constraints raise building costs both directly, by increasing time delays and reducing the amount of available land, and indirectly, by ensuring the homes are produced more on a one-by-one basis rather than in bulk. Third, the supply of housing is kinked and vertical downwards because housing is durable. (2, citation omitted)

These are themes that Glaeser and Gyourko have touched on before, but this essay does a service by updating them ten years after the financial crisis.

Glaeser and Gyourko have consistently hit on some important points that can garner attention at the national level , but there has been no real action on them as of yet:

  • where supply is regulated, housing costs more;
  • heavy land use regulation in places like NYC and SF reduces the nation’s overall economic output; and
  • existing homeowners tend to oppose new projects, which is consistent with their financial self-interest.

Glaeser and Gyourko do not give up hope that policymakers can craft solutions that deal with the political economy of housing construction. One first step would be to develop a toolkit of carrots and sticks that can be employed at the national and state level to incentivize local governments to take actions that are in the interest of their broader communities and the nation as a whole.

We know we need more housing in highly productive regions. We just need to figure out how to build it.

Economic Segregation in NYC and the USA

Richard Florida and Charlotta Mellander have released Segregated City: The Geography of Economic Segregation in America’s Metros. The executive summary reads,

Americans have become increasingly sorted over the past couple of decades by income, education, and class. A large body of research has focused on the dual migrations of more affluent and skilled people and the less advantaged across the United States. Increasingly, Americans are sorting not just between cities and metro areas, but within them as well.
This study examines the geography of economic segregation in America. While most previous studies of economic segregation have generally focused on income, this report examines three dimensions of economic segregation: by income, education, and occupation. It develops individual and combined measures of income, educational, and occupational segregation, as well as an Overall Economic Segregation Index, and maps them across the more than 70,000 Census tracts that make up America’s 350-plus metros. In addition, it examines the key economic, social, and demographic factors that are associated with them. (8)
Although it reads like a jeremiad at times, there is a lot of thought-provoking information in this report. For instance, it examines “the segregation of the three major occupational classes—the creative class of knowledge workers, the even faster growing but lower-paid service class, and the declining blue-collar working class.” (36) It shows that there is a lot of segregation of these classes. This is unsurprising given the correlation between occupational class and income.
As a New Yorker, I immediately focused on the findings relevant to NYC. The report finds that the New York Metro area exhibits a high degree of economic segregation. This is not surprising, but it is interesting to learn where it stands vis a vis other large metro areas — it is sixth highest in the country.
I am not sure what the policy implications are of this report, but it does tell a tale of two cities in one place, one rich and one poor.

The Divided City — New York Edition

Richard Florida and colleagues at the Martin Prosperity Institute have posted a report, The Divided City:  And the Shape of the New Metropolis. The executive summary explains that

To better understand the relationship between class and geography, this report charts the residential locations of the three major workforce classes: the knowledge-based creative class which makes up roughly a third of the U.S. workforce; the fast-growing service class of lower-skill, lower-wage occupations in food preparation, retail sales, personal services, and clerical and administrative work that makes up slightly more than 45 percent of the workforce; and the once-dominant but now dwindling blue-collar working class of factory, construction, and transportation workers who make up roughly 20 percent of the workforce.

 The study tracks their residential locations by Census tract, areas that are smaller than many neighborhoods, based on data from the 2010 American Community Survey. The study covers 12 of America’s largest metro areas and their center cities: New York, Los Angeles, Chicago, Washington, DC, Atlanta, Miami, Dallas, Houston, Philadelphia, Boston, San Francisco, and Detroit. It examines these patterns of class division in light of the classic models of urban form developed in the first half of the 20th century. These models suggest an outward-oriented model of urban growth and development with industry and commerce at the center of the city surrounded by lower-income working class housing, with more affluent groups located in less dense areas further out at the periphery. It also considers these patterns in light of more recent theories of a back-to-the-city movement and of a so-called “Great Inversion,” in which an increasingly advantaged core is surrounded by less advantaged suburbs.

 The study finds a clear and striking pattern of class division across each and every city and metro area with the affluent creative class occupying the most economically functional and desirable locations. Although the pattern is expressed differently, each city and metro area in our analysis has evident clusters of the creative class in and around the urban core. While this pattern is most pronounced in post-industrial metros like San Francisco, Boston, Washington, DC, and New York, a similar but less developed pattern can be discerned in every metro area we covered, including older industrial metros like Detroit, sprawling Sunbelt metros like Atlanta, Houston, and Dallas, and service-driven economies like Miami. In some metros, these class-based clusters embrace large spans of territory. In others, the pattern is more fractured, fragmented, or tessellated.

 The locations of the other two classes are structured and shaped by the locational prerogatives of the creative class. The service class either surrounds the creative class, being concentrated in areas of urban disadvantage, or pushed far off into the suburban fringe. There are strikingly few working class concentrations left in America’s major cities and metros. (iv)

As a New Yorker, I was particularly struck by the map of New York City on page 12. It is striking to see how few blue-collar communities are left in the City and how starkly divided the rest of the City is between the “creative” and “service” classes. This is not particularly surprising, but striking nonetheless.