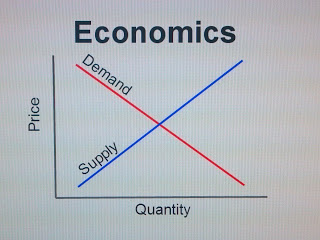
The Economics of Housing Supply


chart by Smallman12q

Housing economists Edward L. Glaeser and Joseph Gyourko have posted The Economic Implications of Housing Supply to SSRN (behind a paywall but you can find a slightly older version of the paper here). The abstract reads,

In this essay, we review the basic economics of housing supply and the functioning of US housing markets to better understand the distribution of home prices, household wealth and the spatial distribution of people across markets. We employ a cost-based approach to gauge whether a housing market is delivering appropriately priced units. Specifically, we investigate whether market prices (roughly) equal the costs of producing the housing unit. If so, the market is well-functioning in the sense that it efficiently delivers housing units at their production cost. Of course, poorer households still may have very high housing cost burdens that society may wish to address via transfers. But if housing prices are above this cost in a given area, then the housing market is not functioning well – and housing is too expensive for all households in the market, not just for poorer ones. The gap between price and production cost can be understood as a regulatory tax, which might be efficiently incorporating the negative externalities of new production, but typical estimates find that the implicit tax is far higher than most reasonable estimates of those externalities.

The paper’s conclusions, while a bit technical for a lay audience, are worth highlighting:

When housing supply is highly regulated in a certain area, housing prices are higher and population growth is smaller relative to the level of demand. While most of America has experienced little growth in housing wealth over the past 30 years, the older, richer buyers in America’s most regulated areas have experienced significant increases in housing equity. The regulation of America’s most productive places seems to have led labor to locate in places where wages and prices are lower, reducing America’s overall economic output in the process.

Advocates of land use restrictions emphasize the negative externalities of building. Certainly, new construction can lead to more crowded schools and roads, and it is costly to create new infrastructure to lower congestion. Hence, the optimal tax on new building is positive, not zero. However, there is as yet no consensus about the overall welfare implications of heightened land use controls. Any model-based assessment inevitably relies on various assumptions about the different aspects of regulation and how they are valued in agents’ utility functions.

Empirical investigations of the local costs and benefits of restricting building generally conclude that the negative externalities are not nearly large enough to justify the costs of regulation. Adding the costs from substitute building in other markets generally strengthens this conclusion, as Glaeser and Kahn (2010) show that America restricts building more in places that have lower carbon emissions per household. If California’s restrictions induce more building in Texas and Arizona, then their net environmental could be negative in aggregate. If restrictions on building limit an efficient geographical reallocation of labor, then estimates based on local externalities would miss this effect, too.

If the welfare and output gains from reducing regulation of housing construction are large, then why don’t we see more policy interventions to permit more building in markets such as San Francisco? The great challenge facing attempts to loosen local housing restrictions is that existing homeowners do not want more affordable homes: they want the value of their asset to cost more, not less. They also may not like the idea that new housing will bring in more people, including those from different socio-economic groups.

There have been some attempts at the state level to soften severe local land use restrictions, but they have not been successful. Massachusetts is particularly instructive because it has used both top-down regulatory reform and incentives to encourage local building. Massachusetts Chapter 40B provides builders with a tool to bypass local rules. If developers are building enough formally-defined affordable units in unaffordable areas, they can bypass local zoning rules. Yet localities still are able to find tools to limit local construction, and the cost of providing price-controlled affordable units lowers the incentive for developers to build. It is difficult to assess the overall impact of 40B, especially since both builder and community often face incentives to avoid building “affordable” units. Standard game theoretic arguments suggest that 40B should never itself be used, but rather work primarily by changing the fallback option of the developer. Massachusetts has also tried to create stronger incentives for local building with Chapters 40R and 40S. These parts of their law allow for transfers to the localities themselves, so builders are not capturing all the benefits. Even so, the Boston market and other high cost areas in the state have not seen meaningful surges in new housing development.

This suggests that more fiscal resources will be needed to convince local residents to bear the costs arising from new development. On purely efficiency grounds, one could argue that the federal government provide sufficient resources, but the political economy of the median taxpayer in the nation effectively transferring resources to much wealthier residents of metropolitan areas like San Francisco seems challenging to say the least. However daunting the task, the potential benefits look to be large enough that economists and policymakers should keep trying to devise a workable policy intervention. (19-20)

How Are First-Time Homebuyers Doing?

photo by designmilk

Genworth Mortgage Insurance Corporation released a a First-Time Home Market Report.  The big news from the report is that first-time homebuyers purchased fifteen percent more single-family homes in 2016 than in 2015.  The 2 million homes purchased in 2016 was the most since 2006, before the financial crisis. This is a positive sign for the housing market and for the homeownership rate which has fallen to long-time lows since the financial crisis. The Executive Summary reads,

First-time homebuyers represent an important segment of the housing market, generating significant revenue to real estate agents, homebuilders, and the mortgage finance industry. In this report, we adopt the Department of Housing and Urban Development (HUD) definition of first-time homebuyers as homebuyers who did not own a home in any of the prior three years  . . . Compared to repeat homebuyers, first-time homebuyers play a more pivotal role in influencing housing inventory and home prices because they represent the shift of housing demand from rental to owner occupancy. Despite this well-recognized dynamic, there has been limited data available on the first-time homebuyer market, starting with market size. In this report, we estimate the size of the first-time homebuyer market going back to 1994 using a combination of government and mortgage industry data—20.1 million actual first-time homebuyers were identified. This data provides a historical perspective on the first-time homebuyer market as well as important recent trends. (2)

The report’s key findings include,

1. Between 1994 and 2016, first-time homebuyers purchased on average 1.8 million single-family homes each year, accounting for over one in three of all single-family homes sold, and 45 percent of the purchase mortgages originated.

2. First-time homebuyers have led the housing recovery, contributing over 60 percent of the sales growth in the housing market over the past five years and 85 percent of the growth in the past two years. The resurgence of the first-time homebuyer market has contributed to very tight housing supplies and accelerating home prices, especially at the “low” end of the housing market.

3. During the Housing Crisis, the number of single-family homes sold to first-time homebuyers saw a peak to trough decline of 900,000 units (43 percent) – reaching a trough of just 1.2 million units in 2011. Over the last 10 years, the housing market has seen 3 million fewer first-time homebuyers in aggregate compared to the historical average.

4. The first-time homebuyer market stagnated during the historic housing expansion of the 1990s and early 2000s, leading to a decline in first-time homebuyer mix. Instead, it was repeat homebuyers, including second-home buyers and investors, who led the surge in housing activity.

5. The expansion of government lending programs and the implementation of the first-time homebuyer tax credit provided temporary support to first-time homebuyers. Between 2008 and 2010, first-time homebuyers represented 35 percent of all single-family home sales, which is close to its historical average. However, the percentage of single-family home sales to first-time homebuyers declined once the tax credit expired, and stayed below 30 percent for these three years.

6. First-time homebuyers have always demonstrated a greater need for low down payment mortgage products. Between 1994 and 2016, 73 percent of first-time homebuyers chose such products compared to 30-50 percent for repeat homebuyers. Mortgage products with a lower down payment will likely have a higher first-time homebuyer mix.

7. Private mortgage insurance and FHA (government-backed mortgage insurance) are the two leading products for first-time homebuyers and have together accounted for close to 1 million first-time homebuyers a year since 1994. They have played a key role in reviving the first-time homebuyer market in the current recovery, accounting for approximately 80 percent of its growth in the past two years.

8. First-time homebuyers purchased 2 million single-family homes in 2016, 15 percent more than 2015 – and the most since 2006. During the first quarter of 2017, there were more first-time homebuyers than any other year since 2005. A total of 424,000 single-family homes were sold to first-time homebuyers, up 11 percent from a year ago, and accounting for 38 percent of all single-family home sales. (3)

NYC’s Housing Supply

The New York City Rent Guidelines Board (of which I am a member) released its 2017 Housing Supply Report. It has a lot of interesting data for housing nerds as well as those of us obsessed with NYC. Here is a taste:

  • There are a total of 3,217,521 units of housing.
  • 2,184,295 are rental units.
    • 848,721 are non-regulated rentals.
    • 1,335,574 are regulated rentals in one form or another (rent stabilized, rent controlled etc.)
  • 1,033,226 are owner units.
    • 116,134 are condos
    • 330,679 are coops
    • 586,413 are conventional homes.

Some other highlights include,

  • Permits for 16,269 new dwelling units were issued in NYC in 2016, a 71.2% decrease over the prior year and the first decrease since 2009.
  • There was a 31.3% decrease in the number of co-op or condo units accepted in 2016, to 282 plans containing 8,671 units.
  • The number of housing units newly receiving 421-a exemptions decreased 17.8% in 2016, to 4,493.
  • The number of housing units newly receiving J-51 abatements and exemptions decreased 22.5% in 2016, to 34,311.
  • The number of new housing units completed in 2016 increased 61.9% over the prior year, to 23,247.
  • Demolitions were down in 2016, decreasing by 2.0%, to 1,849 buildings.
  • City-sponsored residential construction spurred 23,408 new housing starts in FY 2016, 74% of which were rehabilitations.
  • The City-owned in rem housing stock declined 70.2% during FY 2016, to 125 units. (4)

For those who do not know the byzantine world of NYC housing policy, 421-a exemptions relate to new construction and J-51 abatements relate to renovation of existing construction. It is interesting to see how policy changes impact housing construction.

Any one year’s figures provide just a snapshot, so if you really want to get a sense of the big picture, you should check out the earlier reports too. For instance, last year’s report stated that there were permits for 56,528 new dwelling units in 2015, an increase of 176% from 2014.  This is way more than the long term trend. Permits for new dwelling units never got much higher than the low thirty thousand range but fell to a low as six thousand during the depths of the Great Recession.

When you realize that the 421-a tax abatement was set to expire at the end of 2015, this big jump in permits makes sense as developers filed a ton of permits to take advantage of the program while they could. It will be interesting to see how the new 421-a regime will impact permits for new construction going forward.

The Economic Implications of the Housing Supply

Ed Glaeser and Joe Gyourko posted The Economic Implications of the Housing Supply which is forthcoming in The Journal of Economic Perspectives. In it, they

review the basic economics of housing supply and the functioning of U.S. housing markets to better understand the impacts on home prices, household wealth and the spatial distribution of people across markets. Section II documents the state of housing affordability in the U.S., and begins with three core facts about housing supply. First, when building is unrestricted by regulation or geography, housing supply curves seem relatively flat, meaning that we can approximate reality by referring to a single production cost. Second, both geography and regulation severely restrict the ease of building in some parts of the country. These constraints raise building costs both directly, by increasing time delays and reducing the amount of available land, and indirectly, by ensuring the homes are produced more on a one-by-one basis rather than in bulk. Third, the supply of housing is kinked and vertical downwards because housing is durable. (2, citation omitted)

These are themes that Glaeser and Gyourko have touched on before, but this essay does a service by updating them ten years after the financial crisis.

Glaeser and Gyourko have consistently hit on some important points that can garner attention at the national level , but there has been no real action on them as of yet:

  • where supply is regulated, housing costs more;
  • heavy land use regulation in places like NYC and SF reduces the nation’s overall economic output; and
  • existing homeowners tend to oppose new projects, which is consistent with their financial self-interest.

Glaeser and Gyourko do not give up hope that policymakers can craft solutions that deal with the political economy of housing construction. One first step would be to develop a toolkit of carrots and sticks that can be employed at the national and state level to incentivize local governments to take actions that are in the interest of their broader communities and the nation as a whole.

We know we need more housing in highly productive regions. We just need to figure out how to build it.

The Housing Market Under Trump

photo by https://401kcalculator.org

TheStreet.com quoted me in Interest Rates Likely to Rise Under Trump, Could Affect Confidence of Homebuyers. It opens,

Interest rates should increase gradually during the next four years under a Donald Trump administration, which could dampen growth in the housing industry, economists and housing experts predict.

The 10-year Treasury rose over the 2% threshold on Wednesday for the first time in several months, driving mortgage rates higher with the 30-year conventional rate rising to 3.73% according to Bankrate.com. Mortgage pricing is tied to the 10-year Treasury.

Housing demand will remain flat with a rise in interest rates as many first-time homebuyers will be saddled with more debt, said Peter Nigro, a finance professor at Bryant University in Smithfield, R.I.

“With first-time homebuyers more in debt due to student loans, I don’t expect much growth in home purchasing,” he said.

Interest rates will also be affected by the size of the fiscal stimulus since additional infrastructure spending and associated debt “could push interest rates up through the issuance of more government debt,” Nigro said.

Even if interest rates spike in the next year, banks will not benefit, because there is a lack of demand, said Peter Borish, chief strategist with Quad Group, a New York-based financial firm. The economy is slowing down, and consumers have already borrowed money at very “cheap” interest rates, he said.

The policies set forth by a Trump administration will lead to contractionary results and will not spur additional growth in the housing market.

“I prefer to listen to the markets,” Borish said. “This will put downward pressure on the prices in the market. Everyone complained about Dodd-Frank, but why is JPMorgan Chase’s stock at all time highs?”

An interest rate increase could still occur in December, said Jonathan Smoke, chief economist for Realtor.com, a Santa Clara, Calif.-based real estate company. With nearly five weeks before the December Federal Open Market Committee (FOMC) meeting, the market can contemplate the potential outcomes.

“While the market is now indicating a reduced probability of a short-term rate hike at that meeting, the Fed has repeatedly indicated that they would be data-driven in their decision,” he said in a written statement. “If the markets calm down and November employment data look solid on December 2, a rate hike could still happen. The market moves yesterday are already indicating that financial markets are pondering that the Trump effect could be positive for the economy.

“The Fed is likely to start increasing the federal funds rate at a “much faster pace starting next year,” said K.C. Sanjay, chief economist for Axiometrics, a Dallas-based apartment market and student housing research firm. “This will cause single-family mortgage rates to increase slightly, however they will remain well below the long-term average.”

Since Trump has remained mum on many topics, including housing, predicting a short-term outlook is challenging. One key factor is the future of Fannie Mae and Freddie Mac, who are the main players in the mortgage market, because they own or guarantee over $4 trillion in mortgages, remain in conservatorship and “play a critical role in keeping mortgage rates down through the now explicit subsidy or government backing which allows them to raise funds more cheaply,” Nigro said.

It is unlikely any changes will occur with them, because “Trump has not articulated a plan to deal with them and coming up with a plan to deal with these giants is unlikely,” he said.

Trump could attempt to take on government sponsored enterprises such as Fannie Mae and Freddie Mac, said Ralph McLaughlin, chief economist for Trulia, a San Francisco-based real estate website.

“If he does, it’s going to be a hairy endeavor for him, because he’ll need bipartisan support to do so,” he said.

Since he has alluded to ending government conservatorship and allowing government sponsored enterprises to “recapitalize by allowing retention of their own profits instead of passing them on to the Treasury,” the result is that banks could have their liquidity and lending activity increase, which could help boost demand for homes, McLaughlin said.

“We caution President-elect Trump that he would also need to simultaneously help address housing supply, which has been at a low point over the past few years,” he said. “The difficulty for him is that most of the impediments to new housing supply rest and the state and local levels, not the federal.”

Even on Trump’s campaign website, there is “next to nothing” about his ideas on housing, said David Reiss, a law professor at the Brooklyn Law School in New York. The platform of the Republican Party and Vice President-elect Mike Pence could mean that the federal government will have a smaller footprint in the mortgage market.

“There will be a reduction in the federal government’s guaranty of mortgages, and this will likely increase the interest rates charged on mortgages, but will reduce the likelihood of taxpayer bailouts,” he said. “Fannie and Freddie will likely have fewer ties to the federal government and the FHA is likely to be limited to the lower end of the mortgage market.”

Two Cheers for Obama’s Housing Development Toolkit

photo by Daniel Schwen

As the Obama Administration nears the end, the White House released a Housing Development Toolkit. It opens,

Over the past three decades, local barriers to housing development have intensified, particularly in the high-growth metropolitan areas increasingly fueling the national economy. The accumulation of such barriers – including zoning, other land use regulations, and lengthy development approval processes – has reduced the ability of many housing markets to respond to growing demand. The growing severity of undersupplied housing markets is jeopardizing housing affordability for working families, increasing income inequality by reducing less-skilled workers’ access to high-wage labor markets, and stifling GDP growth by driving labor migration away from the most productive regions. By modernizing their approaches to housing development regulation, states and localities can restrain unchecked housing cost growth, protect homeowners, and strengthen their economies.

Locally-constructed barriers to new housing development include beneficial environmental protections, but also laws plainly designed to exclude multifamily or affordable housing. Local policies acting as barriers to housing supply include land use restrictions that make developable land much more costly than it is inherently, zoning restrictions, off-street parking requirements, arbitrary or antiquated preservation regulations, residential conversion restrictions, and unnecessarily slow permitting processes. The accumulation of these barriers has reduced the ability of many housing markets to respond to growing demand.

Accumulated barriers to housing development can result in significant costs to households, local economies, and the environment. (2, emphasis in original)

Glaeser & Gyourko identified the tension between local land use policies and federal affordable housing policies a long time ago, but the federal government has never really done much about it. To its credit, the Obama Administration had touched on it recently, but never in this much depth. So one cheer for the toolkit’s focus on local land use policy as an issue of national concern.

And a second cheer for highlighting actions that states and local governments can take to promote more dynamic housing markets. They include,

  • Establishing by-right development
  • Taxing vacant land or donate it to non-profit developers
  • Streamlining or shortening permitting processes and timelines
  • Eliminate off-street parking requirements
  • Allowing accessory dwelling units
  • Establishing density bonuses
  • Enacting high-density and multifamily zoning
  • Employing inclusionary zoning
  • Establishing development tax or value capture incentives
  • Using property tax abatements (3)

I withhold the last cheer because the toolkit spends no time discussing how the federal government could use its immense set of incentives to encourage state and local governments to take steps to increase the housing supply in high-growth areas. The federal government used such incentives to raise the drinking age and it did it to lower the speed limit. Isn’t the nation’s affordable housing crisis important enough that we should use incentives (such as preferred access to HUD funds) to spur development that is good for Americans collectively as well as for so many Americans individually?

The Looming Housing Crisis for Seniors

photo by Brett VA

Senior Housing in Seattle

TheStreet.com quoted me in Inside the Nation’s Looming Senior Housing Crisis. It opens,

Every day, 10,000 Americans turn 65. That will be true for the next 15 years as the Baby Boomers slide into retirement. Here’s the question: where will they live?

Know that the Social Security Administration said that if you turn 65 today, you will live to 84.3 if you are a man. If you are a woman, it is 86.6. Added SSA: “And those are just averages. About one out of every four 65-year-olds today will live past age 90, and one out of ten will live past age 95.”

Our retirement savings also are paltry. A Government Accountability Office 2015 study said that average Americans between 55 and 64 had about $104,000 in savings. Many have nothing saved.

In 2015 SSA said the average monthly check it issued was for $1,335.

Will there be enough housing to put a roof over every gray head? How will they pay the rent?

When the Bipartisan Policy Center, a Washington, D.C. think tank, recently looked at senior housing, it said in a detailed report: “The current supply of housing that is affordable to the nation’s lowest-income seniors is woefully inadequate. As more low-income Americans enter the senior ranks, this supply shortage — currently measured in millions of units — will become even more acute.”

The good news: many are scrambling to meet the need. There are efforts to provide low income public housing, private affordable housing, and many companies are engaged in developing senior housing for the affluent.

Public housing has been the traditional go-to for those lacking means, seniors included, and many big cities – such as New York, Philadelphia and Chicago – have extensive inventory of income tested senior housing. But there is nowhere near enough. In much of Chicago, the waiting list for senior public housing is over two years. In New York, it is over four. In Philadelphia the public housing waiting list is presently closed, and said the housing authority, it has 104,000 on the wait list. The Philadelphia Housing Authority added: “Due to low turnover, applicants may not reach the top of the waitlist for ten years.”

“Public housing continues to have extremely long waiting lists, so it is not a practical option for many seniors,” said David Reiss, a professor at Brooklyn Law and an expert on housing.